Where will the fans sleep during the World Cup?
What happens when a host nation cannot house every fan? Building optimisation models to forecast Qatar’s FIFA 2022 lodging demand, balance infrastructure needs, and avoid costly overbuilding.

The challenge of lodging a World Cup
When Qatar was picked to host the FIFA World Cup, one question kept nagging at me: where on earth were the fans going to stay?
At most tournaments, that question barely matters. Germany had hotels for days. Brazil had beaches, resorts, entire cities geared for tourism. But Qatar? A country smaller than Yorkshire, with one main city and a handful of hotels. You didn’t need an economics degree to see the problem coming.
Build too little accommodation and you have fans sleeping in rental cars, ticket prices spiking, headlines about “World Cup bed shortages”. Build too much and you end up with a skyline full of empty hotels once everyone goes home. Somewhere in between lies the sweet spot: just enough beds for the busiest night, not a single one more.
That sounds straightforward until you try to calculate it. Because it’s not just about counting stadium seats. It depends on who qualifies, how the draw shakes out, where each match is played, how likely supporters are to travel, and how long they hang around once they arrive. It’s football, tourism, probability, and human behaviour all tangled together.
That’s the kind of puzzle operations research was built for: messy, high stakes, and surprisingly fun! Instead of arguing about it in the pub, you can actually model it, simulate the draw, estimate attendance, forecast bed demand, and see where the crunch points fall.
The puzzle beneath the spectacle
To get to beds per night, I broke the problem into three connected models, building on the framework of Ghoniem et al. (2017).
At first glance, it seems like you could just look at ticket sales and work out how many people are coming. But for a World Cup, even that’s not simple.
Before a single ball is kicked, there’s a long chain of uncertainty. You don’t know which teams will qualify, or how the groups will be drawn. The match schedule exists in abstract, Group A plays on these dates, Group B on those, but nobody knows who will actually be in Group A or B. Each combination changes which fans travel, which matches they attend, and how long they stay.
So to get anywhere close to an answer, I had to model the tournament itself, not after it was drawn, but as if I could run thousands of possible versions of it.
The first part is the draw: 32 nations, four pots, eight groups. Some draws create “groups of death” that everyone wants to watch. Others scatter the strongest teams so that interest is spread more evenly. The more balanced the groups, the more evenly fans travel, which means more people moving around, more demand everywhere.
Then comes the fixture grid. FIFA fixes the order of matches before anyone knows which countries will fill the slots. A group letter - say, “Group D” - carries its own schedule: specific dates, stadiums, and rest days. The luck of being assigned to a certain letter can decide whether your fans stay in Doha or travel hundreds of kilometres across the country.
And finally, there’s the human side. Not all fans behave the same way. Some travel for every group match, others just for one. A Brazilian fan might plan a ten day trip; a Costa Rican fan might pop in for a weekend. Even small differences in enthusiasm or wealth shift the peak night demand by thousands of rooms.
Put all that together, and you end up with a problem that’s part scheduling, part forecasting, part behavioural modelling. It’s less like a logistics exercise and more like building a miniature version of the World Cup inside a spreadsheet, one that has to predict the unpredictable.
Modelling the tournament
To turn a question like “how many beds do we need?” into something answerable, I built the tournament in three connected layers. Each model feeds into the next, from who plays whom, to where they play, to where everyone sleeps.
Step 1: drawing the groups
The World Cup begins with a draw: 32 nations, split into four “pots” based on FIFA ranking points, are assigned to 8 groups. The process is semi-random, but here’s the problem: not all draws are equal. Some produce “groups of death” with several strong teams, while others are lopsided.
Why does this matter? Because competitive, balanced groups attract more fans, making matches more popular and lodging demand higher.
To stress-test lodging needs, I modelled a worst case draw: one where groups are balanced in strength, maximising demand across the board.
Notation
- : set of 32 qualified nations.
- : FIFA points of nation .
- : set of confederations.
- if nation belongs to confederation , else 0.
- : max teams from confederation per group (except UEFA, which can have 2).
- : pot of 8 nations in the -th points tier.
- : set of groups ().
- : 1 if nation is assigned to group , else 0.
- : objective value (minimum group strength).
Optimisation problem
This ensures:
- Every group has 4 teams.
- Each team appears once.
- No two teams from the same pot in a group.
- Confederation rules are respected.
- The minimum total strength across groups is maximised, balancing competitiveness.
The result? Eight balanced groups that maximise match attractiveness and, therefore, lodging demand.
Step 2: group-letter assignment
Once groups are set, they must be assigned to FIFA’s prefixed schedule, where groups correspond to letters (A-H). Each letter comes with a “row-set” of matches, spread across specific dates and stadiums.
The challenge here is to assign groups to letters in a way that matches the most popular games with the largest stadiums.
Match popularity index
To do this, I used a spectator index for each country: a measure of how likely fans are to travel, based on past behaviour (mainly South Africa 2010), adjusted for GDP per capita and distance. For example:
- England: 100
- Brazil: 94
- USA: 100
- Costa Rica: 3
When two nations play, their indices combine to give a match popularity score.
Optimisation problem
The goal is to maximise both the minimum and maximum row-set popularity, ensuring demand is well distributed and big matches go to big stadiums.
Constraints ensure:
- Each group is assigned to one letter.
- Each letter has one group.
- Qatar (Group A) plays the opening match in Lusail Stadium.
This step maps demand to specific venues, setting the stage for lodging needs.
Step 3: lodging requirements
Now comes the heart of the question: how many beds are needed per night?
Two fractions govern seat allocation:
- : share reserved for officials.
- : share of the remainder allocated to each team’s fans.
Fan behaviour is probabilistic:
- Fans from wealthy or nearby nations are more likely to attend all three group matches.
- Others may only attend one or two.
- Fans arrive on the day of their first game and leave the day after their last.
Lengths of stay therefore vary between 3 and 10 nights.
By summing these patterns across all matches, I obtained nightly lodging requirements.
So what did the numbers say
Running the full chain of models produced a surprisingly sharp picture of Qatar’s World Cup logistics.
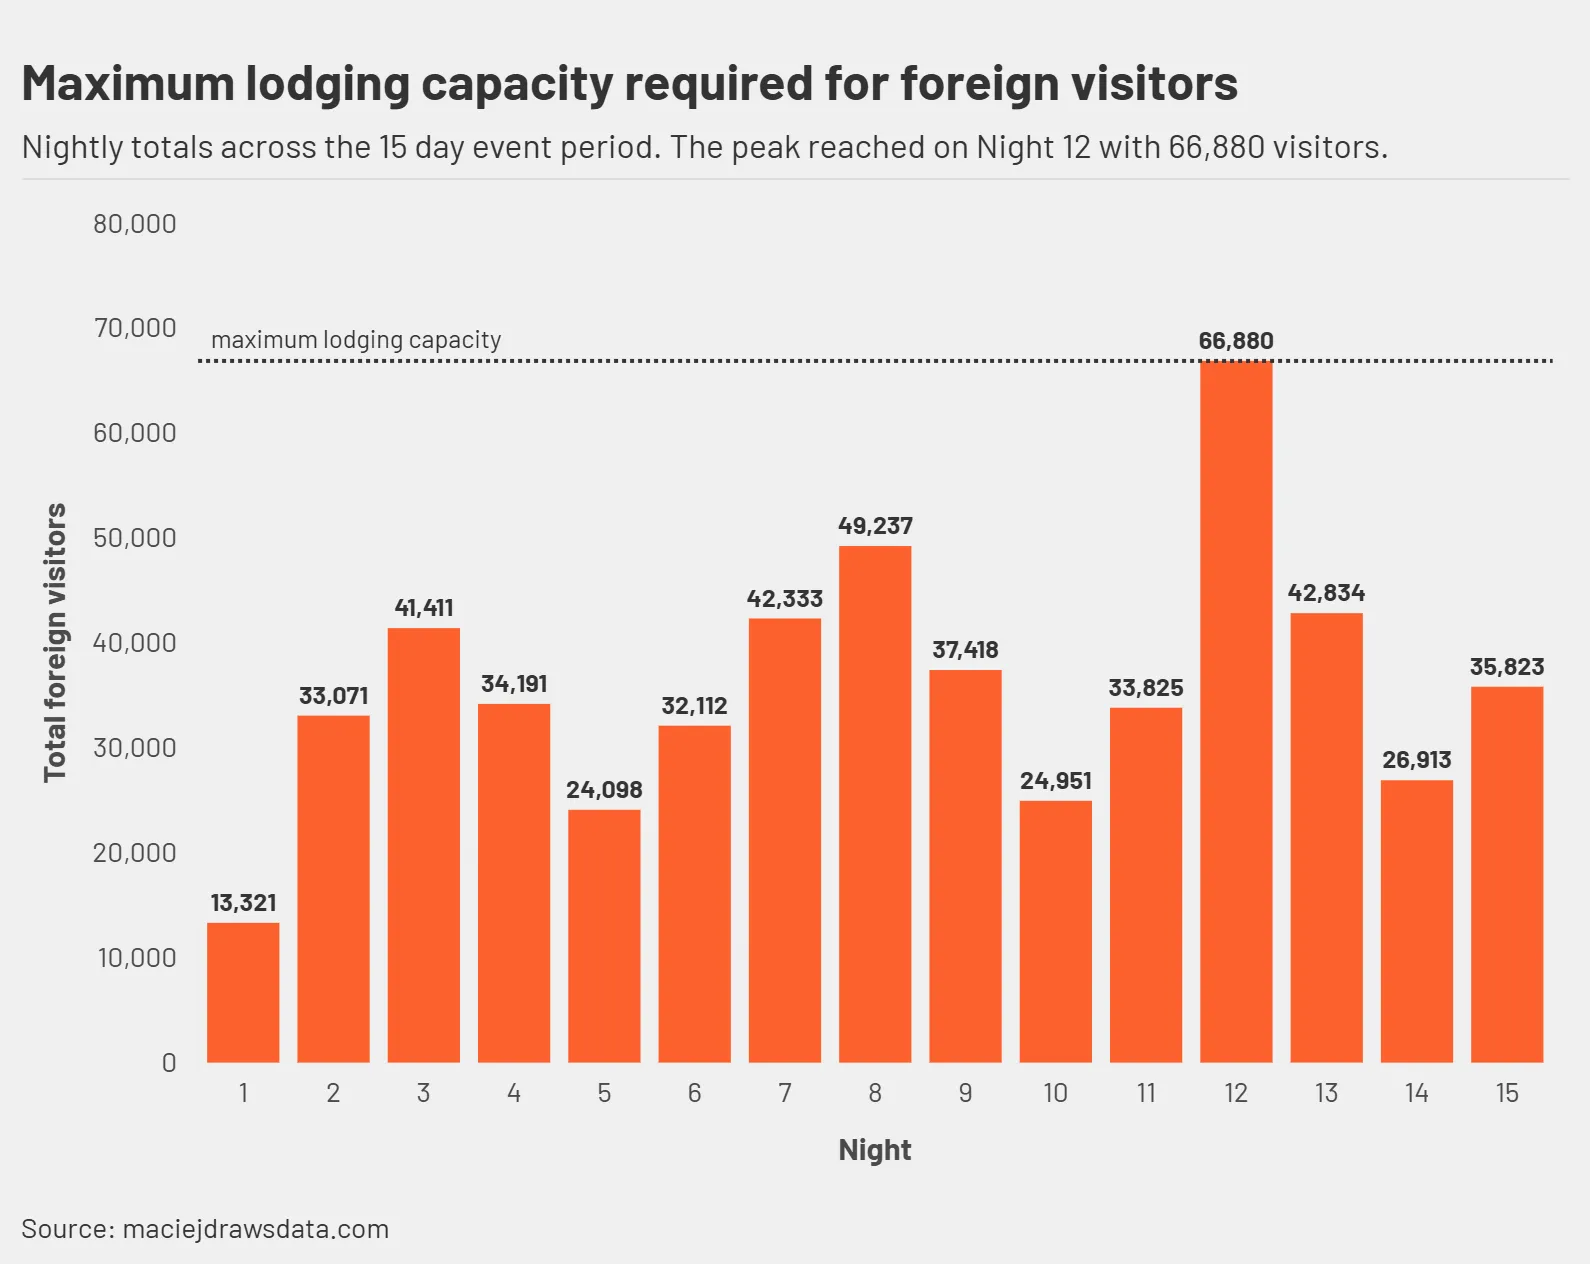
At its peak, the simulation predicted about 66,880 international visitors on a single night of the group stage, the moment when the schedule, match popularity, and fan behaviour all overlapped. That figure sits just above FIFA’s internal benchmark of 60,000 available rooms, suggesting that in a perfectly balanced, high-demand scenario, Qatar could have faced a modest shortfall if it had built only to the guideline.
What makes this interesting is how sensitive the number is. Small shifts in assumptions, fan enthusiasm, travel cost, or match timing, pushed the peak up or down by thousands of rooms.
To understand the margins, I ran a few stress tests.
Covid related restrictions
If stadium capacities were cut by a fraction (k), lodging demand fell almost linearly by the same proportion. At a 20% reduction, the nightly peak dropped to roughly 53,000 visitors, enough to make the shortage disappear, but at the cost of a quieter tournament atmosphere.
Spectator enthusiasm
Increasing the spectator index across the board by 10% (fans more likely to travel or stay longer) pushed the nightly maximum beyond 70,000 visitors. Even small surges in excitement produced large infrastructure consequences: thousands of rooms, hundreds of millions of dollars.
Length of stay
If average stays stretched by just one additional night per visitor, the tail of the lodging curve thickened, peaks softened slightly, but total occupancy rose across the entire month. It’s the difference between a single spike and a sustained plateau of demand.
What it means
Forecasting demand for a World Cup is a reminder that the hardest part of planning isn’t always the data, it’s the assumptions.
Every number in the model depends on judgement calls: how likely fans are to travel, how long they stay, how ticket allocations are split. A small tweak to any of them can shift the answer by thousands of beds.
That’s not a flaw; it’s the nature of large scale events. Operations research doesn’t eliminate uncertainty, it makes it visible. It helps planners see which levers matter most, and how costly each wrong move might be.
For Qatar, the implication was clear. Building strictly to FIFA’s guideline risked running short on the busiest nights. Building to the model’s upper range risked overspending by billions on infrastructure that might never be used again. The best option lay somewhere between those extremes, with temporary housing, cruise ships, and flexible capacity filling the gaps.
More broadly, the same logic applies far beyond football. From Olympic villages to music festivals, the real constraint isn’t just budget or land, it’s uncertainty itself. The more we can model behaviour, timing, and probability together, the better our decisions become.
Models can’t give certainty, but they can give structure. And in planning, as in football, that’s often what wins the game.